Porky No. 3.
And its the biggest of them all.
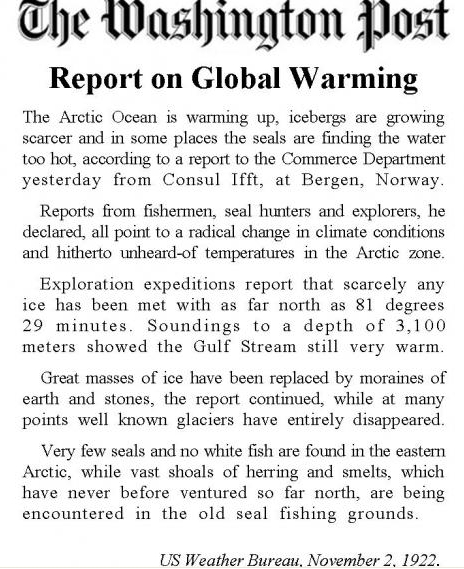
The IPCC in their 1990 report Fig 7.1 c clearly (and correctly) show the Medieval Warm Period running (depending at which temp you think should herald the start) at about 900 AD to about 1350 AD.
Between 1100AD and 1300 AD it shows as being warmer than the present.

Quote from IPCC 1990 Report
“There is growing evidence that worldwide temperatures were higher than at present during the mid-Holocene (especially 5,000-6,000 BP) at least in summer, though carbon dioxide levels appear to have been quite similar to those of the pre-industrial era at this time (Section 1). Thus parts of western Europe, China, Japan, the eastern U.S.A. were a few degrees warmer in July during the mid-Holocene than in recent decades (Yoshino and Urushibaru, 1978; Webb et al 1987; Huntley and Prentice, 1988; Zhang and Wang, 1990). Parts of Australasia and Chile were also warmer. The late tenth to early thirteenth centuries (about AD950-1250) appear to have been exceptionally warm in western Europe, Iceland and Greenland (Alexandre 1987; Lamb, 1988). This period is known as the Medieval Climatic Optimum. China was, however, cold at this time (mainly in winter) but south Japan was warm (Yoshino 1978). This period of widespread warmth is notable in that there is no evidence that it was accompanied by an increase of greenhouse gases. Cooler episodes have been associated with glacial advances in alpine regions of the world such neo-glacial episodes have been increasingly common in the past few thousand years. Of particular interest is the most recent cold event, the Little Ice Age which resulted in extensive glacial advances in almost all alpine regions of the world between 150 and 450 years ago (Grove 1988) so that glaciers were more extensive 100-200 years ago than now nearly everywhere (Figure 7.2) Although not a period of continuously cold climate, the Little Ice Age was probably the coolest and most globally extensive cool period since the Younger Dryas. In a few regions, alpine glaciers advanced down-valley even further than during the last glaciation (Miller, 1976). Some have argued that an increase in explosive volcanism was responsible for the coolness (for example Hammer 1977; Porter 1986); other claim a connection between glacier advances and reductions in solar activity (Wigley and Kelly, 1989) such as the Maunder and Sporer solar activity minima (Eddy, 1976) but see also Pittock (1983). At present there is no agreed explanation for these recurrent cooler episodes. The Little Ice age came to an end only in the nineteenth century. Thus some of the global warming since 1850 could be a recovery from the Little Ice Age rather than a direct result of human activities. So it is important to recognize that natural variations of climate are appreciate and will modulate any future changes induced by man. Schematic diagrams of global temperature variations since the Pleistocene on three time-scales: (a) the last million years; (b) the last ten thousand years, and (c) the last thousand years. The dotted line nominally represents conditions near the beginning of the twentieth century.
These graphs from the IPCC 1990 report which show earlier warmings such as the Roman Warming etc, accompany the above quotation.

Graphs showing past 900,000 years climate temperatures until present.
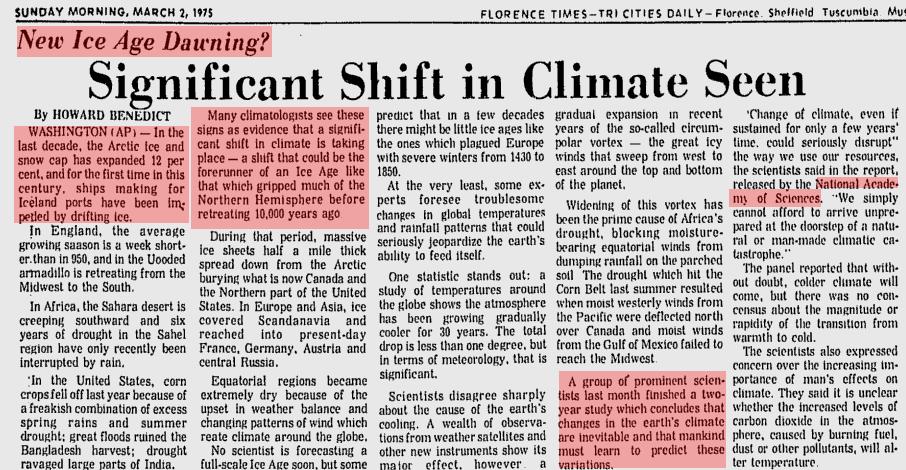
But hello hello hello? When we look at the IPCC in 2001 the original graph is gone and has been replaced by the good old hockeystick graph which has simply ignored the Medieval Warm Period. Unlike the first graph, its still online at:- http://www.ipcc.ch/ipccreports/tar/wg1/005.htm
Here is my file copy in case the above one gets erased. Its larger anyway.

IPCC 2001 hockeystick graph
A change like that would warrant a careful explanation one would think, but none was ever offered.
Its obvious to me that having a relatively recent period where the temperatures were warmer than present is an embarrassment for the IPCC.
Understandably so! as the association of global warming with co2 levels does not hold sway at all if it can be shown that the world temperatures were warmer before us humans put extra CO2 into the atmosphere.
Below is an email about these graphs from the climategate hacking.
This is scary stuff! It shows and confirms that the IPCC and it’s so called scientists are ready to try anything including trying to change history in order to maintain their facade of global warming!
Note that the subject is “Figure 7.1c from the 1990 IPCC Report” which is the very graph I mentioned in the beginning!
Here is a graph of CO2 measured by chemical means since 1812! Why is this data ignored by the IPCC?

CO2 measured from 1812-2004 by chemical methods from Ernst-Georg Beck and Merian-Schule Freiburg, 8/2006 "180 Years accurate CO2 - Gasanalysis of Air"
Check out a summary of the paper here https://rogerfromnewzealand.files.wordpress.com/2010/01/180_years_accurate_co2_chemical_methods1.pdf
Excerpts from ClimateGate Emails:-
From: Phil Jones To: William M Connolley ,Caspar Ammann Subject: Figure 7.1c from the 1990 IPCC Report Date: Fri, 05 Jan 2007 13:38:40 +0000 Cc: Tom Crowley ,”Michael E. Mann” , “raymond s. bradley” , Stefan Rahmstorf , Eric Steig ,gschmidt@xxxxxxxxx.xxx, rasmus.benestad@xxxxxxxxx.xxx,garidel@xxxxxxxxx.xxx, David Archer , “Raymond P.” ,k.briffa@xxxxxxxxx.xxx, t.osborn@xxxxxxxxx.xxx, “Mitchell, John FB (Chief Scientist)” , “Jenkins, Geoff” , “Warrilow, David (GA)” , Tom Wigley ,mafb5@xxxxxxxxx.xxx, “Folland, Chris” Dear All, I’ve added a few extra names in the cc of this email list to see if we can definitively determine where the figure in the subject title comes from. The background is that the skeptics keep referring back to it and I’d like to prove that it is a schematic and it isn’t based on real data, but on presumed knowledge at some point around the late 1980s. If you think it is based on something real. What we’d like to do is show this either on ‘Real Climate’ or as background in a future paper, or both. I’m attaching a few diagrams as background (attaching in order of introducing them) and giving some earlier thoughts. I assume you all have a copy of the said diagram in the first IPCC report. 1. This is where the IPCC diagram came from – the top panel is also there, but the middle one from IPCC isn’t. This is where Chris Folland knows it came from. He said it was shoehorned in at a very late date. This report comes from a UK Dept of the Environment document – where the first edition predates 1990. David Warrilow says that this was written by Geoff Jenkins and John Mitchell. John said the following I think it was based on a diagram A2 in the national Academy of Sciences boolet “Understanding climate change” cirica 1974 if rmeber correctly- I can find out in Reading tomorrow- which I can’t find in the library- it was reproduced in one of John Gribbens books and I think a book claled the “1982 CO2 review”. I think there 6 diagrams and I remember Tom Wigley commenting that only the first ( millions of years) and Last ( instrumental record) had any credibility. and National Research Council, US Committee for the Global Atmospheric Research Program, Understanding Climatic Change: A Program for Action, National Academy of Sciences, Washington, DC, (1975), appendix A. 2. This 1975 book has the 3rd attachment on p130 . This is very similar to one that David Warrilow said (also attached from Imbrie and Imbrie – second attachment). from David I can’t be sure but I think the original diagram is from Imbrie and Imbrie : Imbrie, John and Katherine Palmer Imbrie. Ice ages: Solving the Mystery. Cambridge, Massachusetts: Harvard University Press, 1979, 1986 (reprint). ISBN 0-89490-020-X; ISBN 0-89490-015-3; ISBN 0-674-44075-7. p. 25 These look the same if you invert and rotate the one from 1975, and they both say ‘winter conditions in Eastern Europe’ – well Imbrie/Imbrie do. They also say adapted from Lamb (1969). This is the World Survey of Climatology series from Landsberg, vol2. I’ve been through this and I can’t see much of a plot anything like those I’ve attached, so some adaptation. Also I’ve no idea what this Eastern European series is! The IPCC diagram and the UK report clearly don’t originate here. 3. Caspar Amman had John Gribbin’s 1982 book and sent the 4th attachment. This has a warmer MWP, but is far too cool recently. So even if this was resmoothed, it wouldn’t before the IPCC one. 4. Ray Bradley sent this text: I believe this graph originated in a (literally) grey piece of literature that Jack Eddy used to publish called “Earth Quest”. It was designed for, and distributed to, high school teachers. In one issue, he had a fold-out that showed different timelines, Cenozoic, Quaternary, last 100ka, Holocene, last millennium, last century etc. The idea was to give non-specialists a perspective on the earth’s climate history. I think this idea evolved from the old NRC publication edited by L. Gates, then further elaborated on by Tom Webb in the book I edited for UCAR, Global Changes of the Past. (This was an outcome of the wonderful Snowmass meeting Jack master-minded around 1990). I may have inadvertently had a hand in this millennium graph! I recall getting a fax from Jack with a hand-drawn graph, that he asked me to review. Where he got his version from, I don’t know. I think I scribbled out part of the line and amended it in some way, but have no recollection of exactly what I did to it. And whether he edited it further, I don’t know. But as it was purely schematic (& appears to go through ~1950) perhaps it’s not so bad. I note, however, that in the more colourful version of the much embellished graph that Stefan circulated ( [1]http://www.politicallyincorrect.de/2006/11/klimakatastrophe_was_ist_wirkl_1.html the end-point has been changed to 2000, which puts quite a different spin on things. They also seem to have fabricated a scale for the purported temperature changes. In any case, the graph has no objective basis whatsoever; it is purely a “visual guess” at what happened, like something we might sketch on a napkin at a party for some overly persistent inquisitor….. (so make sure you don’t leave such things on the table…). What made the last millennium graph famous (notorious!) was that Chris Folland must have seen it and reproduced it in the 1995 IPCC chapter he was editing. I don’t think he gave a citation and it thus appeared to have the imprimatur of the IPCC. Having submitted a great deal of text for that chapter, I remember being really pissed off that Chris essentially ignored all the input, and wrote his own version of the paleoclimate record in that volume. There are other examples of how Jack Eddy’s grey literature publication was misused. In a paper in Science by Zielinski et al. (1994) [v.264, p.448-452]–attached– they reproduced [in Figure 1c] a similarly schematic version of Holocene temperatures giving the following citation, “Taken from J. A. Eddy and R. S. Bradley, Earth-quest 5 (insert) (1991), as modified from J. T. Houghton, G. J. Jenkins, J. J. Ephraums, Climate Change, The IPCC Scientific Assessment (Cambridge Univ. Press, Cambridge, 1990).” But I had nothing to do with that one! So, that’s how a crude fax from Jack Eddy became the definitive IPCC record on the last millennium! 5. Finally, here’s one from Stefan, to show how the IPCC diagram gets (first another one which appears to be the IPCC 1990 diagram). The one I want to attach seems to be within Stefan’s email so that is the end of this email. You can also get to this by going to the link in Ray’s piece above. It shows how you can embellish a diagram and even get Rembrandt in! I’ve also seen many other embellishments mentioning Greenland, the Vikings, Vineyards in York, frost fairs on the Thames etc. Also I’ve emailed over the years for the numbers in the 1990 IPCC Figure. I even got a digitized version once from Richard Tol and told him what he’d done was ludicrous. 6. So who put to together? Do we blame Ray? Is it a whim of his excellent imagination? I know we will all likely agree with Ray that it is based on absolutely nothing. Tom Crowley thinks it might be based on Lamb and sent the final figure. Now all of those who are or were in CRU know, you should be very careful with Lamb diagrams! This one does not stand any scrutiny and there are several more recent papers by Tom Wigley, Astrid Ogilvie and Graham Farmer that have shown that this final diagram is irreproducible and it was much cooler in the 11-13th centuries. It is also England and summer only. The galling thing is, it does look like the IPCC Figure!!!!!! When Tom sent the figure, he added this text (see below). The figure looks like Figure 30 (I’ve not scanned this one), but will, from his 1982 (reprinted in 1985 and 1995) called Climate History and the Modern World. This figure has series for the year, JJA and DJF. Someone tell me it isn’t based on a Lamb diagram, please…. Phil Tom Crowley said we still don’t have an adequat explanation as to how Jack “cooked up” that figure – I do not believe it was purely out of thin air – look at the attached – which I used in the Crowley-Lowery composite just because it was “out there” – I made no claim that it was the record of record, but just that it had been used beforer. the Lamb ref. is his book dated 1966. I will have to dig up the page ref later. Dansgaard et al. 1975 Nature paper on Norsemen…etc used that figure when comparing what must have been their Camp Century record – have to check that too – where the main point of that paper was that the timing of Medieval warmth was different in Greenlandn and England! 25 years later my provocation for writing the CL paper came from a strong statement on the MWP by Claus Hammer that the canonical idea of the MWP being warming than the present was correct and that the 1999 Mann et al was wrong. he kept going on like that I reminded him that he was a co-author on the 1975 paper! that is also what motivated to do my “bonehead” sampling of whatever was out there just to see what happened when you added them all together – the amazing result was that it looked pretty much like Mann et al. ther rest is history — much ignored and forgotten. I might also pointn out that in a 1996 Consequences article I wrote – and that Fred Singer loves to cite — Jack (who was the editor of the journal) basically shoehorned me into re-reproducing that figure even though I didn’t like it – there was not an alternative. in the figure caption it has a similar one to Zielinski except that it states “compiled by R.S. Bradley and J.A. Eddy based on J.T. Houghton….so that puts a further twist on this because it point to Houghton not Bradley/Eddy as the source. Jack must have written that part of the figure caption because I don’t think I knew those details. but we still don’t know where the details of the figure came from – the MWP is clearly more schematic than the LIA (actually the detailsl about timing of the samll wiggles in the LIA are pretty good) – maybe there was a meshing of the Greenland and the England records to do the MWP part – note that the English part gets cooler. they may also have thrown in the old LaMarche record – which I also have. maybe I can schlep something together using only those old three records. tom Stefan said the reason why I started to worry about this is the attached graph. Recognise something? – Used in school teaching in Germany, Austria and Switzerland, is on a website with officially recommended teacher materials – Used in university teaching in Germany – Used in politics in Germany by people within the FDP. Note the vertical axis label on that, by the way. The text that goes with it claims the medieval warm period was 2-4 ºC warmer than today. Climate sceptics material, of course. Cheers, Stefan 13a7140.jpg – Prof. Phil Jones Climatic Research Unit Telephone +44 (0) 1603 592090 School of Environmental Sciences Fax +44 (0) 1603 507784 University of East Anglia Norwich Email p.jones@xxxxxxxxx.xxx NR4 7TJ UK —————————————————————————-

[…] 11:40 Global Warming (or is it Global Cooling)’ https://rogerfromnewzealand.wordpress.com/porky-no-3-ipcc-attempts-to-change-history/ […]
Pingback by 23 — Medieval Warm Period — fact vs. fiction | Stahuj cz filmy a MP3 zdarma — March 1, 2013 @ 8:31 pm |
[…] 11:40 Global Warming (or is it Global Cooling)’ https://rogerfromnewzealand.wordpress.com/porky-no-3-ipcc-attempts-to-change-h… […]
Pingback by Medieval Warm Period: Fact vs. Fiction « Dandelion Salad — July 29, 2012 @ 5:36 pm |
Interestingly enough, taking a look a jstor – just for example – shows a whole host of articles which pull back from the extremes previously estimated for the MWP (though some summers were still had higher averages). Of course, arguments about global and localised warming cut both ways here, as some try (not unconvincingly) to demonstrate that the extensive assarting that went on in Europe could have added to the warming. Haven’t heard of anyone trying to hide the MWP as such, but a number of centers for ice core measures show less “MWP consistent data. Still, Europe’s MWP seems pretty well accepted and demonstrated.
I think the most interesting solar / climate based article I’ve come across in a long while is one on price fluctuations in medieval English wheat markets being influenced by solar minima and maximma. The idea wasn’t new either – c.1830s it was floated by an English scientist (and member of the royal soc, if I remember rightly). Though back then the idea was widely ridiculed, this article makes and compelling case. Fascinating to think that solar storms can be “seen” through history like that. Strangely, a century or two before, solar influence to that extent on the earth might have seen as axiomatic to educated European natural scientist. The idea of the net solar heat radiation input being globally consistent threw many people off the scent of the sun’s influence. Anyways, all interesting stuff.
Comment by schermster — September 27, 2010 @ 10:47 pm |
Great to hear from you.
You might be interested to check the links listed under “Links to illustrate the Globalness of the Medieval Warm Period and other Warmings” on my main page http://www.rogerfromnewzealand.wordpress.com
Also read the climate gate emails above and see if you think they are talking about the MWP. Also Mann’s hockeystick graph also implies that the MWP did not exist. Thats what I mean by attempts to change history.
Cheers
Roger
Comment by rogerthesurf — September 28, 2010 @ 9:09 am |
And in answer to your question of why the IPCC didn’t cite it, perhaps that’s because they don’t tend to cite papers published in second-rate journals that dismiss 50 years of climate methodology research for no apparent reason.
Comment by Alex — August 12, 2010 @ 11:33 am |
It would be at least reasonable for the IPCC to publically consider the data that Beck quotes and explain why they think it is invalid as it would also have been reasonable for the IPCC to explain why they dropped the graph above and adopted Mann’s hockeystick instead.
As for the MWP upon which there are attempts to erase from history, I suggest you check out the list of links devoted to that subject on my home page. I suggest also you read the climategate emails which are included on this page.
Cheers
Roger
Comment by rogerthesurf — August 12, 2010 @ 11:53 am |
Here’s something on your graph, in specific. http://www.realclimate.org/index.php/archives/2007/05/beck-to-the-future/
Comment by Alex — August 12, 2010 @ 11:25 am |
A little note on the source for your graph: http://www.realclimate.org/index.php/archives/2007/06/curve-manipulation-lesson-2/
Comment by Alex — August 12, 2010 @ 11:23 am |
When the next mini or more glacial period begins. The Northern Hemisphere will be most effected. When they accept this, that I doubt they will for the next few decades, as Carbon credits investments and clean energy (if there is any) begin to decrease in value.
When the Northern hemisphere with its larger population masses realises that they can’t grow enough food etc., it will become a problem. It should be
a problem, but without acceptance that the globe is cooling they can’t take the necessary actions to adapt to this.
I’ll be dead by then. But a clearer view of the planet’s gravitation from ice ages to interglacial might help humans to adapt eventually.
I’m still for sustainability though.
Comment by Bush bunny — April 9, 2010 @ 2:09 am |
The later graph was based on data actually collected, and not on diary accounts. How much explanation is required?
Ed,
We are not sure what you are talking about here. Would you like to write the comment again?
Cheers
Roger
Comment by Ed Darrell — February 9, 2010 @ 3:59 am |
I just read one site, and I thought the response was so funny, whether they were being serious or not, I don’t know. But the poster said
“The graphs were very well put together, but quite irrelevant, as we all
know the Earth and humans are only 6,000 years old ….”
So … and … The chairman of the IPCC is a Hindoo, believes in many Gods
so what evil is he trying to perpetrate in the name of all humanity..”
Well obviously that poster can’t spell Hindu, but just goes to show, that
ones religious beliefs can influence ones opinion on Climate Change too. LOL
Comment by Bush bunny — January 28, 2010 @ 6:10 pm |